
L.A. Multifamily Sales Jump 44%
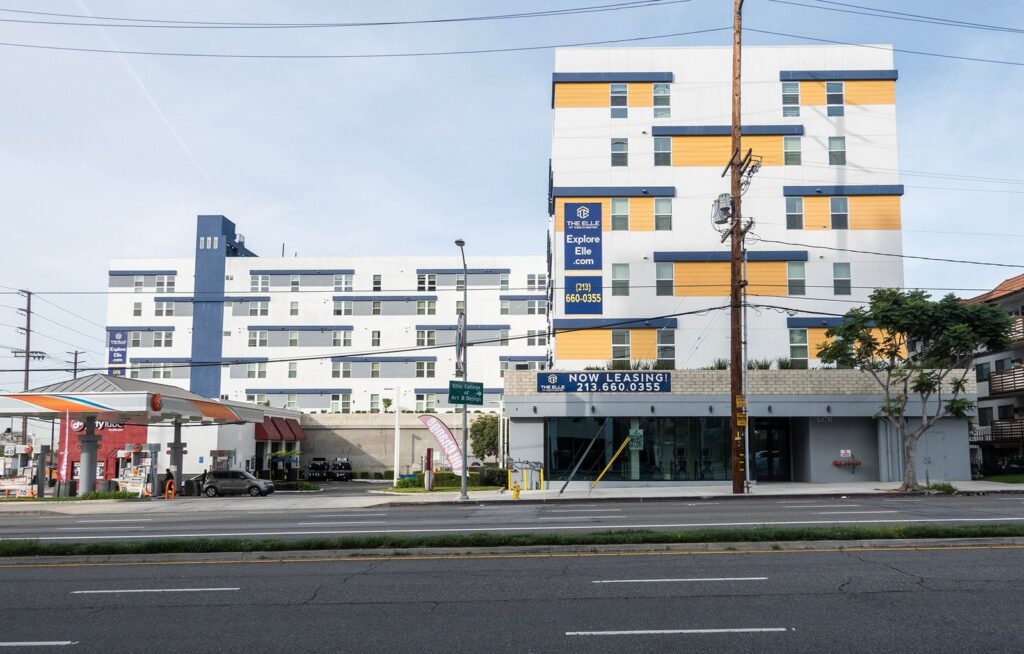
Los Angeles County multifamily investment sales are up after the third quarter while average rent and occupancy rates appear to be stuck in neutral.
Sales volume for multifamily properties with 50 or more units reached $3.3 billion so far on the year, up 44 percent from the same period in 2025, while the average sale price declined to $357,085 per unit, according to a new Colliers market report.
At the same time, L.A.’s apartment occupancy rate held at 94.1 percent in the third quarter, unchanged from the previous quarter, and down only slightly from 94.4 percent a year earlier.
Average monthly effective rent increased by $6 to $2,428 per unit in the third quarter, but it is back to the same rate after the third quarter of 2025.
Colliers pinned both the annual decline in occupancy and the static rent in part to new construction. Colliers estimates developers added 4,277 units during the third quarter, which is about 72 percent more than in the second quarter. Absorption of these units totaled 3,809 units, up significantly from 2,429 the previous quarter and 2,360 a year ago.
However, the apartment construction pipeline is shrinking. There were 23,426 units under construction at the end of the third quarter, down from 24,877 in the second quarter and 25,421 a year earlier. L.A. County has completed more than 58,800 apartments since the second quarter of 2021, per Colliers.
The Westside remained the most expensive area, with average effective rents at $3,336 per month, despite occupancy of 92.9 percent. The submarket also had the largest development pipeline with 5,894 units under construction.
The Hollywood and Mid-Wilshire neighborhoods recorded an average rent of $2,355 and occupancy of 92 percent, the second-lowest occupancy rate for the top submarkets. It also led the region in new deliveries with 1,869 units added during the quarter, while 5,113 units are under construction.
Downtown and the areas going into Central L.A. posted the market’s lowest occupancy rate at 91.7 percent, even though that’s a 1.1 percent annual bump.
South L.A. posted the highest occupancy rate at 96.6 percent, with rents averaging $1,996 per month. The South Bay followed at 95.8 percent occupancy and average effective rents of $2,436.
Gregory Cornfield can be reached at gcornfield@commercialobserver.com.
Source: commercialobserver.com — article syndicated from the publisher’s feed; all rights remain with the original publisher.